
Tracking Sheets
These sheets are for keeping track of how long each worksheet took, or how many answers were correct on the memory activities. A row of results tells you more about how things are going than any single try.
The sheets are simple enough for kids to fill in on their own. Watching their own record grow can also be a good starting point for looking back together. All three print on US Letter or A4, in landscape.
-
Time Log
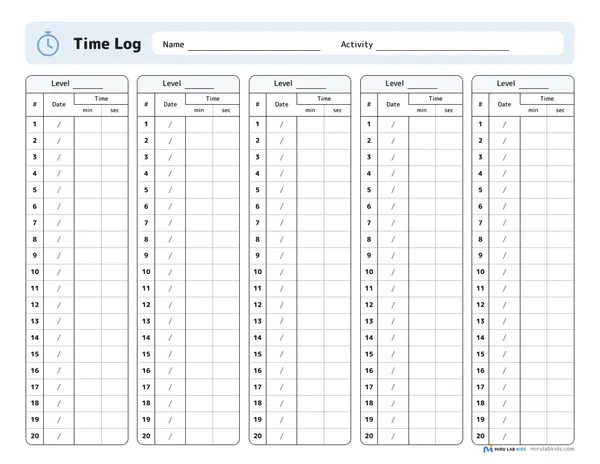
For the searching, tracing, and copying activities. Copy the time from the bottom of the worksheet. Five level boxes, 20 tries each.
Open PDF (US Letter, landscape)Open PDF (A4, landscape) -
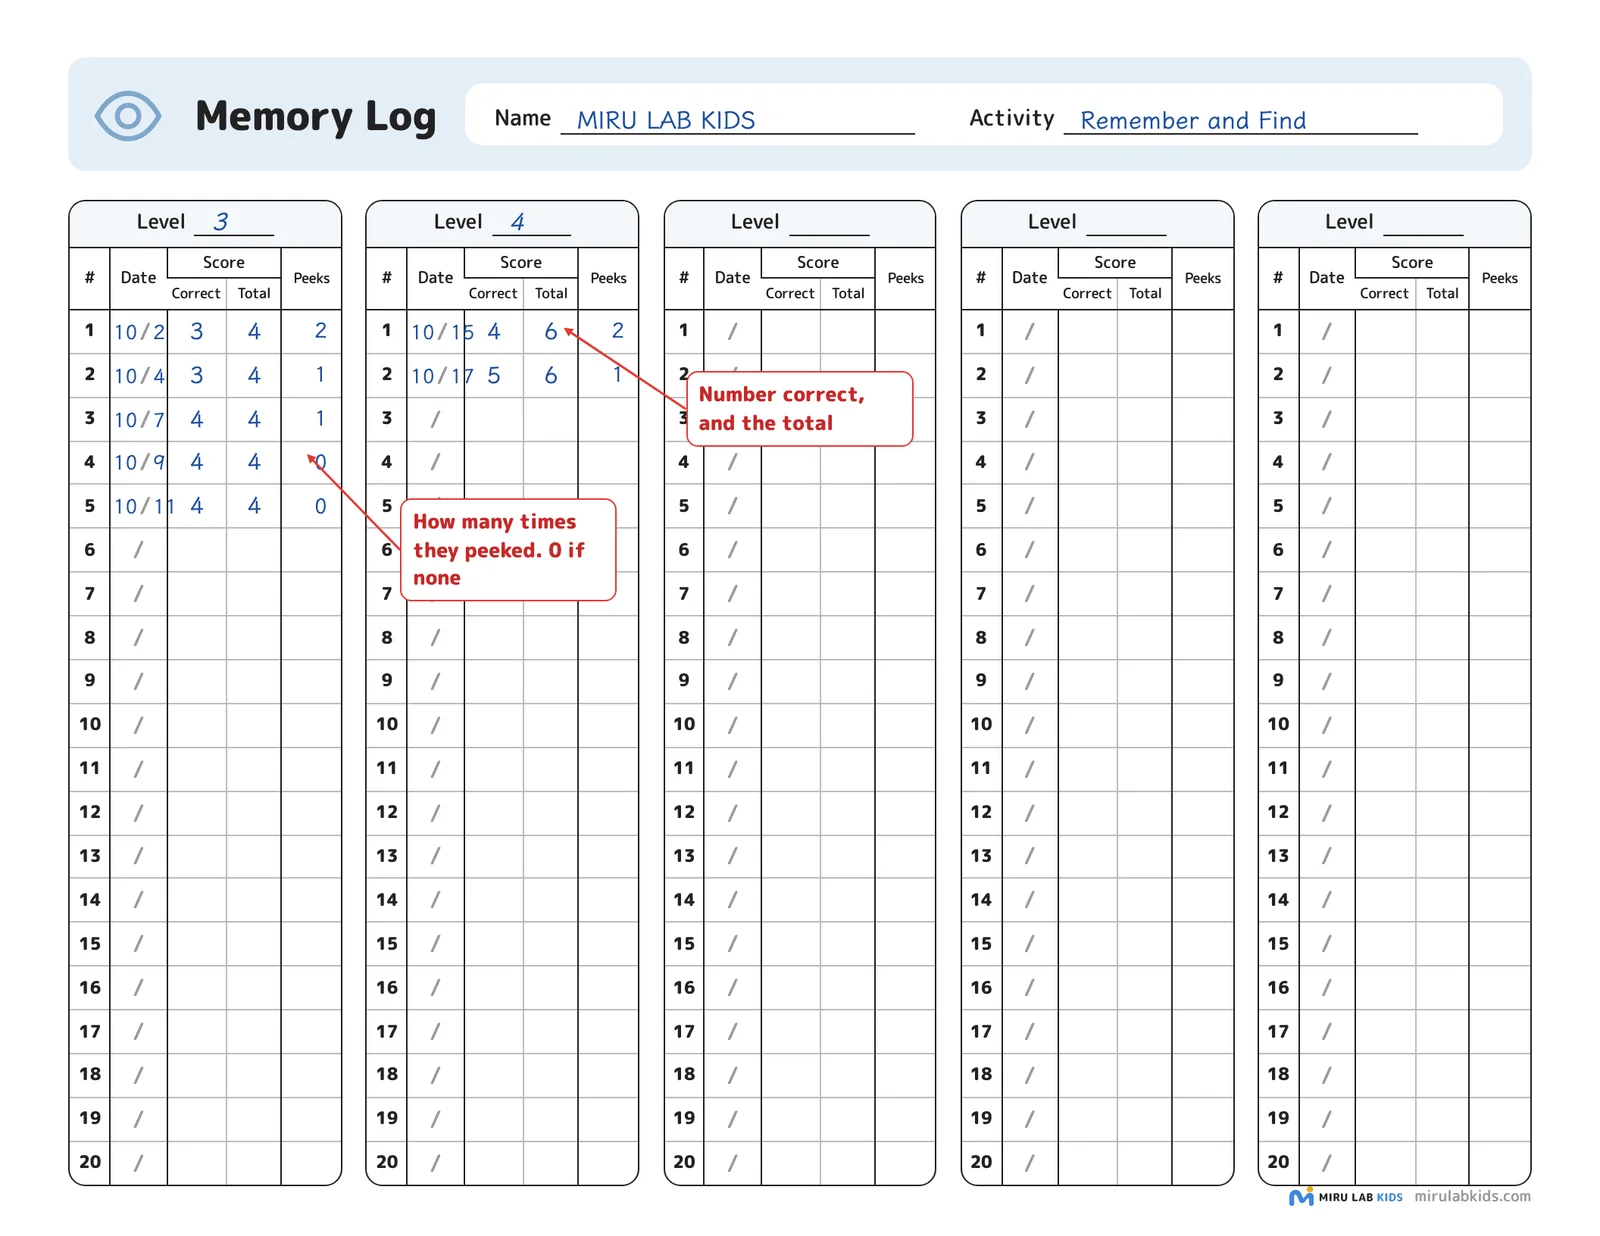
Memory Log
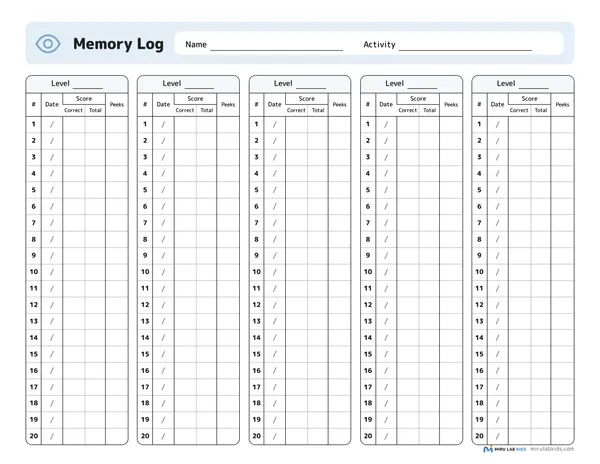
For "Remember the Order" and "Remember and Find." Instead of the time, write the number correct and how many times they peeked.
Open PDF (US Letter, landscape)Open PDF (A4, landscape) -
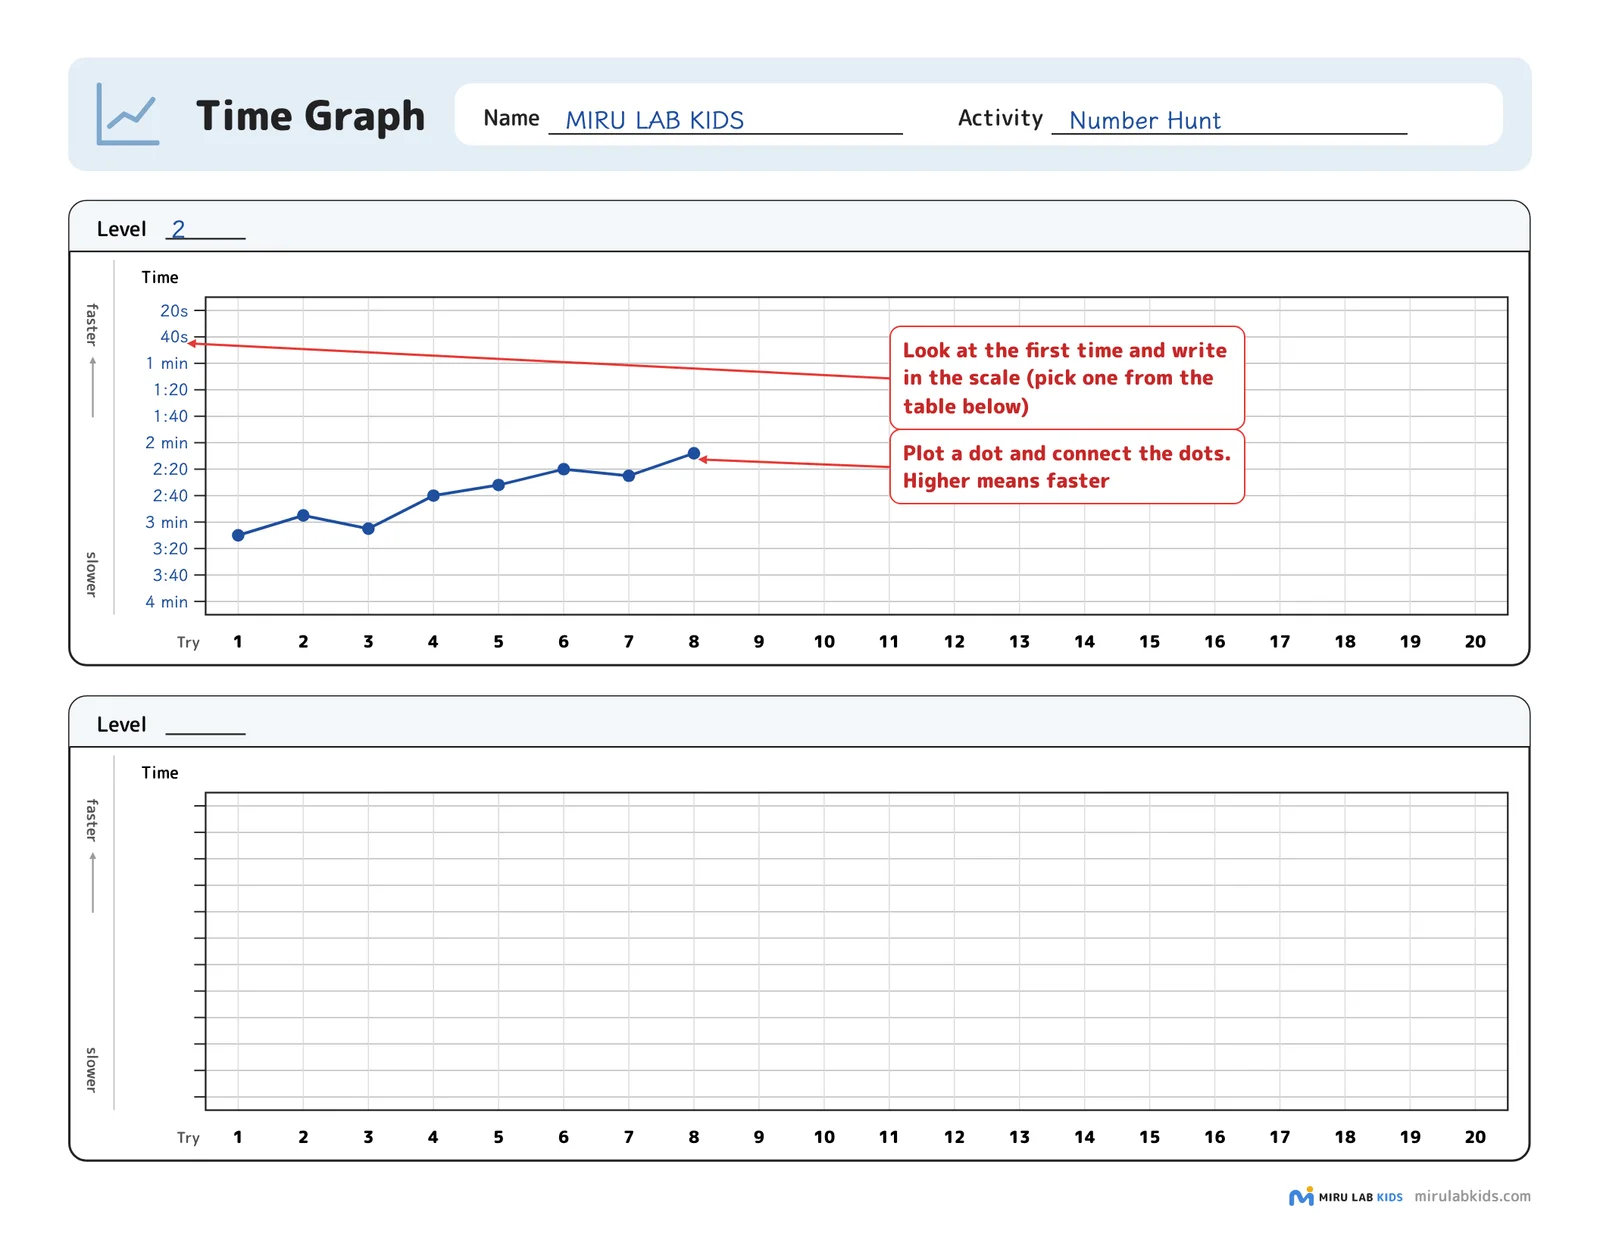
Time Graph (to draw by hand)
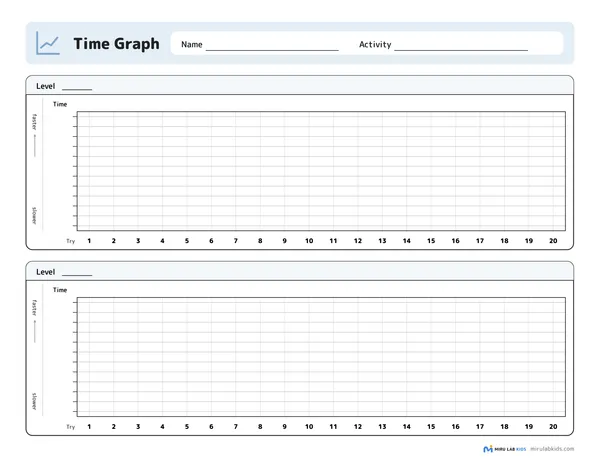
For turning the Time Log into a graph. Higher means faster. An adult writes in the numbers on the time scale.
Open PDF (US Letter, landscape)Open PDF (A4, landscape)
Make a graph on screen
Type the times from the Time Log on a computer or phone, and get a graph with the scale set automatically.
Which sheet should I use?
- Time Log: Find the Same Shape, Number Hunt, Circle the Numbers, Mazes, Follow the Lines, Dot-to-Dot, Dot Grid Copying, Symmetry Coloring, and every other activity except the memory ones. For the copying activities, too, the time (including the time spent looking and thinking) is a useful guide.
- Memory Log: Remember the Order and Remember and Find (shapes and pictures). With the memory activities, what matters is how much they could hold in mind, not speed, so you write the number correct instead of the time.
How to fill in the Time Log
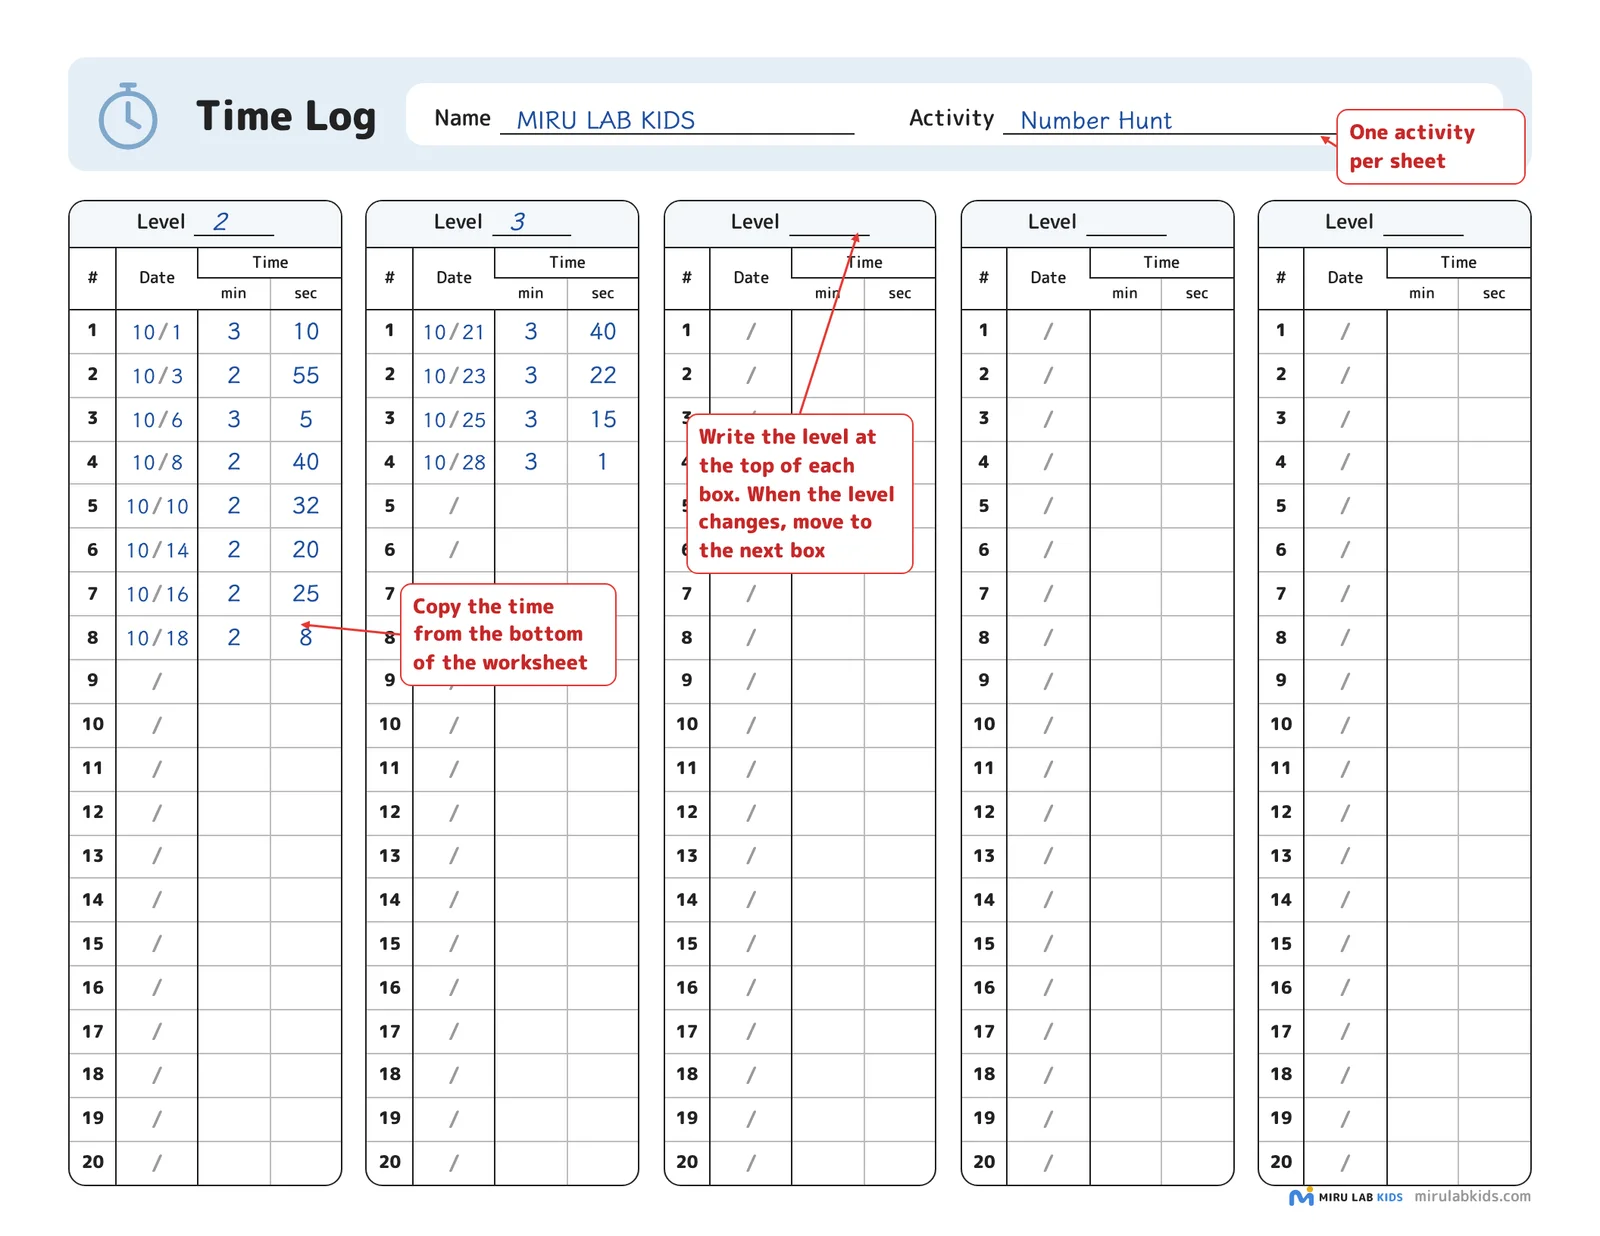
- Use one sheet per activity. Write the child's name and the activity name at the top.
- Write the level number at the top of each box. Keep writing in the same box while the level stays the same, and move to the next box when the level changes. If you go back down a level, continue in that level's box.
- Copy the time from "Time" at the bottom of the worksheet. Write the date like "10/24."
How to fill in the Memory Log
- Under "Correct," write how many they got right, and under "Total," how many there were (for example, Correct 3, Total 4). For Remember and Find, the total is the number after "Find" on the worksheet.
- If they can't remember, it's okay to unfold the paper and look again. Write how many times they did this under "Peeks." Fewer peeks over time is a change worth noticing, too. Let the child decide for themselves whether to peek.
How to draw the graph by hand
- If you'd rather type the results in, use the Graph Maker. It sets the scale for you.
- Look at the first time, and write numbers on the time scale. Put shorter times (faster) at the top. If you pick the row in the table below that matches the first time, the dots will land near the middle of the graph.
- Use each graph for one activity at one level only. Plot a dot for each try and connect the dots.
| First time | Numbers to write on the lines (from the top) | |||||||||||
|---|---|---|---|---|---|---|---|---|---|---|---|---|
| 1 | 2 | 3 | 4 | 5 | 6 | 7 | 8 | 9 | 10 | 11 | 12 | |
| Up to 0:50 | 0:05 | 0:10 | 0:15 | 0:20 | 0:25 | 0:30 | 0:35 | 0:40 | 0:45 | 0:50 | 0:55 | 1:00 |
| 0:50–1:40 | 0:10 | 0:20 | 0:30 | 0:40 | 0:50 | 1:00 | 1:10 | 1:20 | 1:30 | 1:40 | 1:50 | 2:00 |
| 1:40–2:30 | 0:15 | 0:30 | 0:45 | 1:00 | 1:15 | 1:30 | 1:45 | 2:00 | 2:15 | 2:30 | 2:45 | 3:00 |
| 2:30–3:20 | 0:20 | 0:40 | 1:00 | 1:20 | 1:40 | 2:00 | 2:20 | 2:40 | 3:00 | 3:20 | 3:40 | 4:00 |
| 3:20–5:00 | 0:30 | 1:00 | 1:30 | 2:00 | 2:30 | 3:00 | 3:30 | 4:00 | 4:30 | 5:00 | 5:30 | 6:00 |
| 5:00–10:00 | 1:00 | 2:00 | 3:00 | 4:00 | 5:00 | 6:00 | 7:00 | 8:00 | 9:00 | 10:00 | 11:00 | 12:00 |
Numbers are minutes:seconds (1:20 = 1 minute 20 seconds).
When you look back at the record
Compare only the child's own results for the same activity at the same level.
Times change with how the child is feeling that day. The overall trend over several tries tells you more than any one up or down.
When a child looks back and says "I got faster!" or "That one was hard today," take a moment to talk it over together.