
Graph Maker
Type in the times from the Time Log, and a graph appears. The scale is set automatically to fit the results.
Everything you type stays on this screen and is never sent to the site. It disappears when you close the page, so print it or save it as a PDF if you want to keep it.
Don't have the sheets yet?
Results for one activity at one level, oldest first, up to 20 tries. Type a date as four digits (1024 becomes 10/24), or pick it from the calendar.
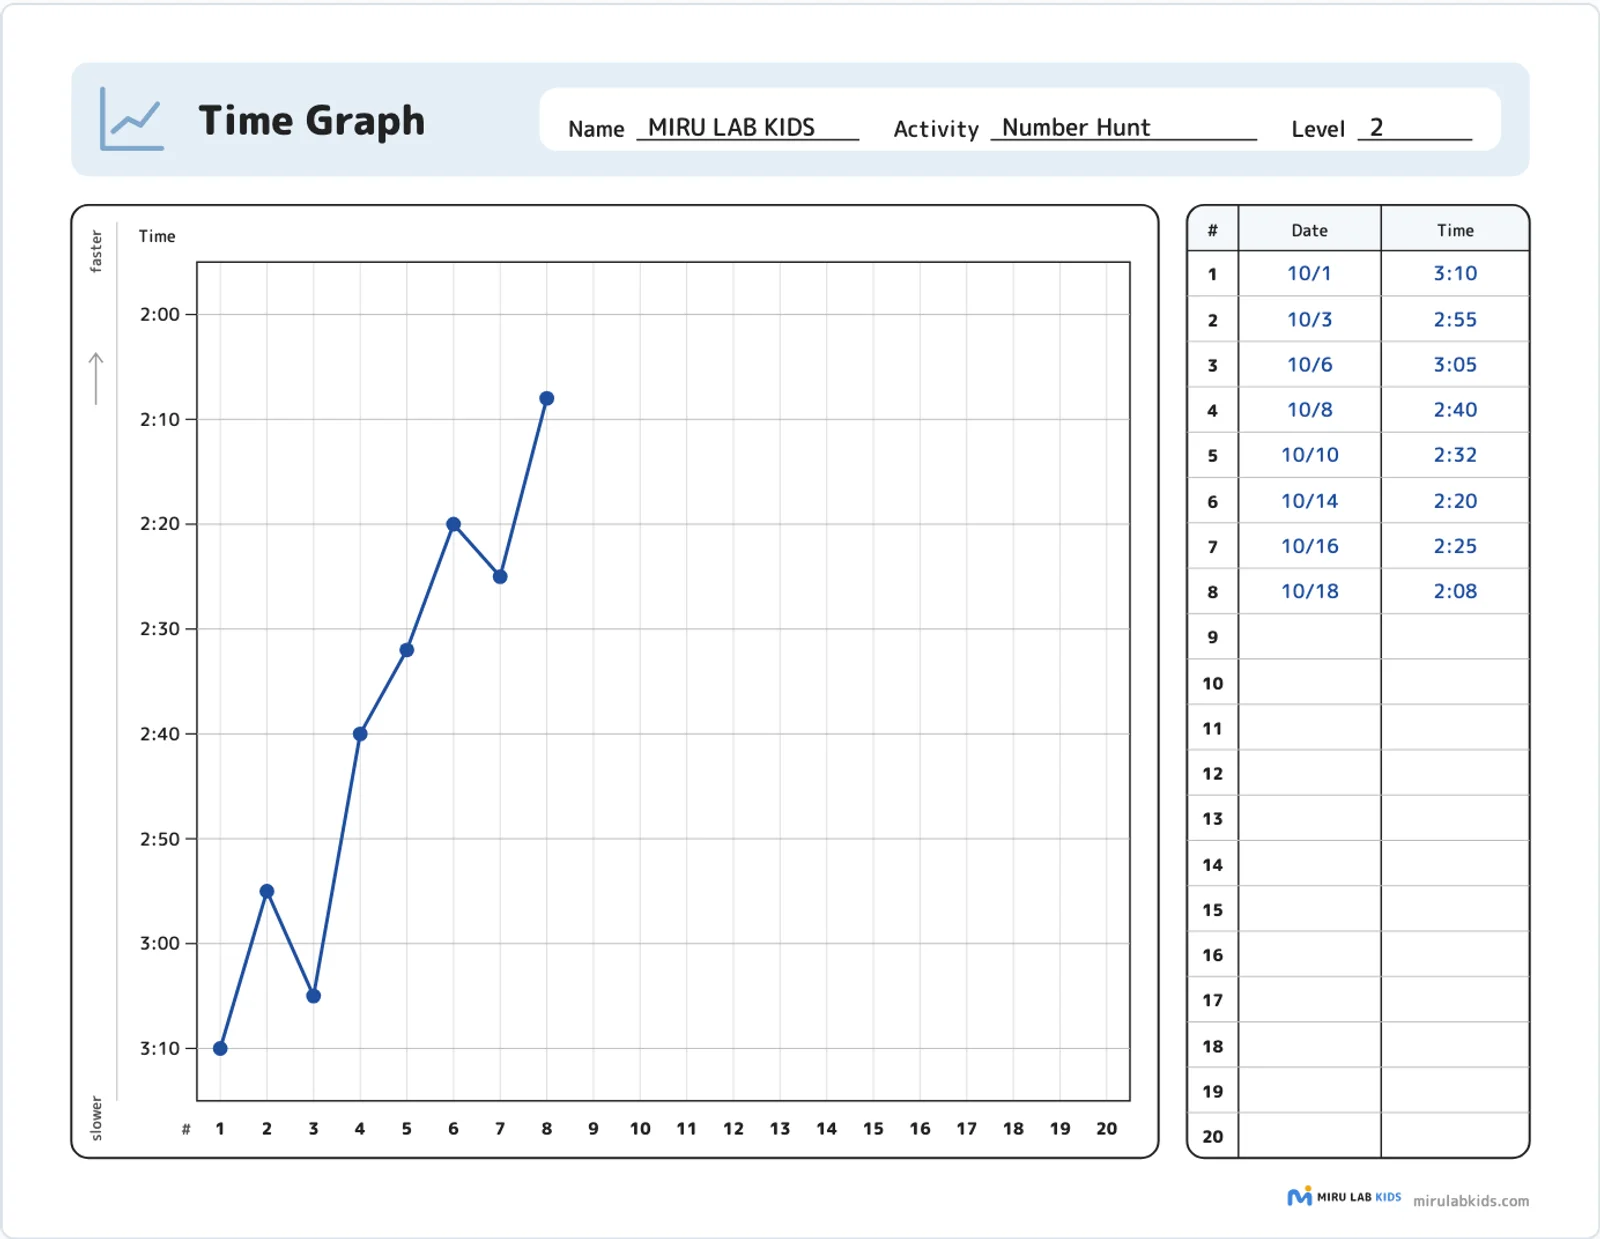
The printed page
In the print window, choose "Save as PDF" instead of a printer to make a PDF.
How to use it
- Choose the activity and the level. The name is optional. The memory activities (Remember the Order and Remember and Find) aren't timed, so they aren't listed here.
- Looking at the Time Log, type in the date and time for each try.
- The graph builds as you type. Press "Print" to print the graph and the record table together on one landscape page.
Reading the graph
- Higher means faster (a shorter time). The numbers on the scale are minutes:seconds, so 1:30 is 1 minute 30 seconds.
- Use each graph for one activity at one level only. When the level changes, make a new graph.
- The overall trend over several tries tells you more than any one up or down. Compare only the child's own results.